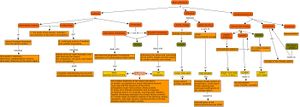
Group A - Concept Mapping of Seminar Topics
The Scientific Perspective of Climate Change
Concept Map
Intro
The concept map above serves as the summarized overlook of the lecture The perspective of climate research. It shows the basic connections between the different topics of the lecture but alone is not enough for deeply study the topic.
If you wish to work further on our basic concept map please contact us. Or save a copy from our map on the server of the Cmap plattform: Public Place 3 / create your own folder / IMLA 2012 / Group A / The content of the lecture 'The perspective of climate research'.
The first part of the lecture: definitions and organisation
Although the key message of the lecture is more than just the generall introduction of the basic definitions usable in the science of environment, these are essentially important to understand the consequences of the natural processes and human activities on our earth. To the complex processes like the greenhouse effect etc. you can find proper illustrations in the lecture. In order to better understand the definitions we prepared a secondary detailed concept map about it.
How to read the detailed basic definitions concept map
These boxes contains the main concepts.
The term climate differs in color because on this point the definitions can be connected.
These square boxes are the longer descriptive part of the definitions.
The definitions are so similar that usually just the time factor of the terms differs, you can see it in the yellow square boxes.
If you are well prepared in this topic please continue your learning process on the next main concept: Main organisation. The organisation IPCC collects all the information about the topic climate change and models the possible future through different scenarios on different scales.
Datas and Methods
The datas are collected by using various methods by observation of consequences of the past and the present climate for the prediction of the datas of the future climate. During Palaeoclimate the datas were collected by the observation of coral trees, lake rings, pollen, ice cores whereas in present the observations are done near surface by (WMO synop) weather stations, upper air soundings with radiosondes and by satellite observation globally.
The future climate is predicted by analysing the past, present and future time-spans using complex computer programs, physical simulation models, comparable with numerical weather prediction models due to which there is increase of complexity and resolution in models which are becoming more realistic all the time.
Global Climate Change
Observation
The global climate change shows the warming of global climate system like atmosphere, ocean, melting of ice caps/sea ice, sea-level rise near surface. According to which of the last 12 years 11 belonged to the 12th hottest years within 150 years. The Palaeo-analysis shows that there has been uncommon recent warming, decrease of ice volume and increase of sea level. The 2nd half of 20th century was very likely the warmest 50-year period within 500 years and within the last 1300 years. There has been increase of precipitation in East of North and South America, Northern Europe, Northerly and Central Asia and decrease in precipitation in Sahel, Mediterranean, southern Africa, Southern Asia. The rapid decrease of Arctic sea-ice has been extended 3% per decade, 7%per decade during summer causing sea-level rise by about 17 cm in 20th century.
Reasons
The main reason for global climate changes is due to the emission of long-lived greenhouse gases like CO2, CH4, SO formed by burning fossil fuels and land use changes which concentration is higher ever before 650,000 years; this is obviously due to the human influences which can be seen on temperature, circulation patterns, extreme events. Anthropogenic Aerosols are cooling the climate and therefore compensate some of the warming trend which is further needed to be investigated.
Scenario
Depending on the emission scenario global mean temperature increases by 1.8 to 4k until 2100, weakest scenario: 1.1 to 2.9k and strongest 2.4 to 6.4k (65% likelihood for both), even freezing greenhouse gas emission at today's level means 0.1k/decade temperature rise. The higher uncertainty ranges due to more complex models including the carbon cycle and higher temperature means less carbon uptake. There is more likely droughts due to more frequent and longer heat waves, decrease of frost days, increase of vegetation periods and tendency for dry summer conditions. The precipitation changes are robust with increase at high latitudes and decrease over Continents and Sub-tropics. There is more likely to be sea level rise by 20 to 60 cm in 21st century and Greenland ice sheet melting within the upcoming 1000 years. The Meridional overturning in the Atlantic is slowing down, less salt in the upper layer waters due to which there is cooling effect for European climate. There is overcompensation due to Anthropogenic warming causing unlikely breakdown of the ocean conveyer belt.
Our comments
More attention should be paid to regional climate models because the global problem of climate change is created by changes in smaller regions.
Problem of climate change should be much more prevalent, and every single person should take an active part in the inhibition of these changes.
Regional climate models are much more accurate and more efficient and all projections and scenarios should be based on them.
