Group K - Concept Mapping of Seminar Topics: Difference between revisions
| (10 intermediate revisions by 2 users not shown) | |||
| Line 1: | Line 1: | ||
* Back to [[Working_Groups_Seminar_Climate_Change_2012|working group overview]] | * Back to [[Working_Groups_Seminar_Climate_Change_2012|working group overview]] | ||
* [[Group K - Collaborative Climate Adaption Project]] | * [[Group K - Collaborative Climate Adaption Project]] | ||
== | == Concept Map Themes: == | ||
''Engaging Communities on Climate Change with Visual Learning Tools'' | |||
'''''Engaging Communities on Climate Change with Visual Learning Tools''''' | |||
Presented by: professor Stephen Sheppard PhD., ASLA, Collaborative for Advanced Landscape Planning, UBC Pacific Institute for Climate Solutions | |||
and | '''''Energy Landscapes and Social Acceptability''''' | ||
Presented by: Dr. Olaf Schroth, University of Sheffield / University of British Columbia, Pacific Institute for Climate Solutions PICS | |||
== Concept Map == | == Concept Map == | ||
[[ | |||
[[File:Group_K_concept map.jpg]] | |||
== Discussion == | == Discussion == | ||
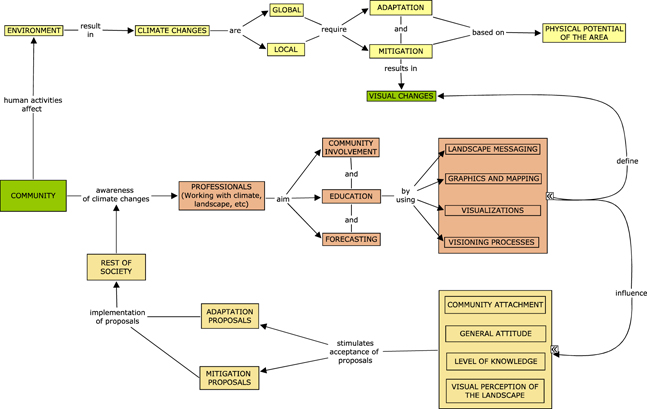
Visual learning tools have become an extremely important part of dealing with climate change. Because human activities are the main cause of climate changes, people are the ones who need to be educated on what the consequences are and what needs to be done to adapt to and mitigate the negative effects of climate changes. Experience has shown that visual media leads to faster understanding of problems by local communities because it allows them to ''see'' into the future and what might or will inevitably happen if no action or a specific action is taken and that results in a better response from the community and their willingness to support necessary measures. | |||
People can be informed through various visual learning tools such as photos of impacts and measures implemented elsewhere which could be applied in their community as well, photo simulations of how a measure would directly impact their area, graphics and mapping, 2D, 3D and 4D visualizations of different possible future scenarios. All these tools help people to understand the problems and participate in finding and/or implementing solutions and the results get more accurate over time because of more and more data we are able to gather. | |||
Through direct participation people can also design their own visual learning tools such as messaging by labelling, an example of which was given in the lecture – residents of Tidy Street in Brighton, UK were creating a chart of their daily electricity use by chalk-spraying it on the street outside their homes as a measure of mitigation that would serve to educate others as well as themselves. | |||
All this leads us to a conclusion that visual learning tools and models are a well functioning method that should be implemented along side the usual facts and numbers because their use so far has confirmed that pictures do in fact speak louder than words. | |||
Latest revision as of 10:37, 20 January 2013
Concept Map Themes:
Engaging Communities on Climate Change with Visual Learning Tools
Presented by: professor Stephen Sheppard PhD., ASLA, Collaborative for Advanced Landscape Planning, UBC Pacific Institute for Climate Solutions
Energy Landscapes and Social Acceptability
Presented by: Dr. Olaf Schroth, University of Sheffield / University of British Columbia, Pacific Institute for Climate Solutions PICS
Concept Map
Discussion
Visual learning tools have become an extremely important part of dealing with climate change. Because human activities are the main cause of climate changes, people are the ones who need to be educated on what the consequences are and what needs to be done to adapt to and mitigate the negative effects of climate changes. Experience has shown that visual media leads to faster understanding of problems by local communities because it allows them to see into the future and what might or will inevitably happen if no action or a specific action is taken and that results in a better response from the community and their willingness to support necessary measures.
People can be informed through various visual learning tools such as photos of impacts and measures implemented elsewhere which could be applied in their community as well, photo simulations of how a measure would directly impact their area, graphics and mapping, 2D, 3D and 4D visualizations of different possible future scenarios. All these tools help people to understand the problems and participate in finding and/or implementing solutions and the results get more accurate over time because of more and more data we are able to gather.
Through direct participation people can also design their own visual learning tools such as messaging by labelling, an example of which was given in the lecture – residents of Tidy Street in Brighton, UK were creating a chart of their daily electricity use by chalk-spraying it on the street outside their homes as a measure of mitigation that would serve to educate others as well as themselves.
All this leads us to a conclusion that visual learning tools and models are a well functioning method that should be implemented along side the usual facts and numbers because their use so far has confirmed that pictures do in fact speak louder than words.
